
Memory leaks can be a serious issue if your server has some web application running on it. A memory leak can slow down your web application after applying some dll on it. So, in this case, we can track memory leaks by creating a memory dump file with the very small tool i.e “DebugDiagx64“.
Supported Operating System
- Windows Server 2012
- Windows 8
- Windows Server 2012 R2
- Windows 8.1
- Windows 10
- Windows Server 2016
Track Memory Leaks and create dump with DebugDiagx64 Tool
- DebugDiagx64 tool comes with the option to track memory usage of a running process with the help of a small dll called LeakTrack.
- LeakTrack can attach to the process in question and monitor memory allocations and their related call stacks.
- Since the dll is injected into the process it can have a slight impact on performance.
DebugDiagx64 can be downloaded from Microsoft.
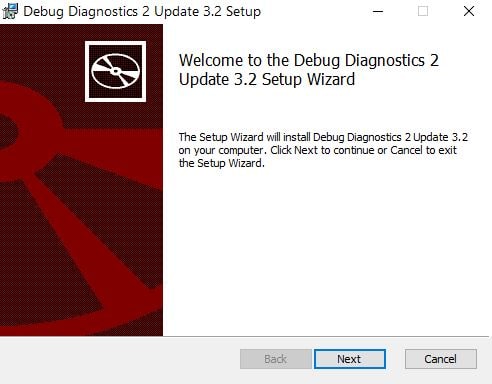
Step 1
Once the download is finished, run DebugDiagx64 installer on your Windows system.
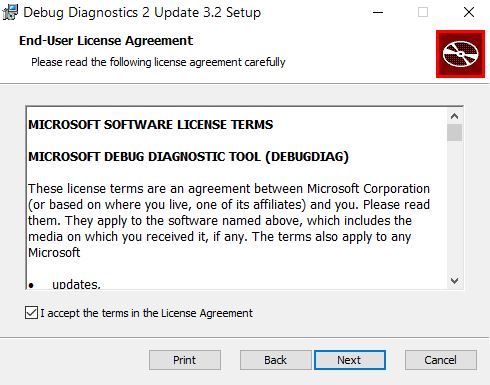
Step 2
Check on terms and click next.
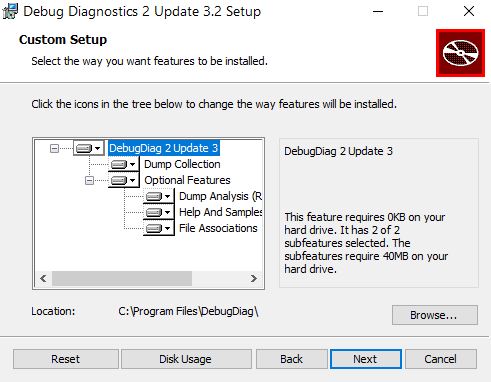
Step 3
Do not change anything here, keep the default options and click next and install the software.
Steps to configure DebugDiag Tool
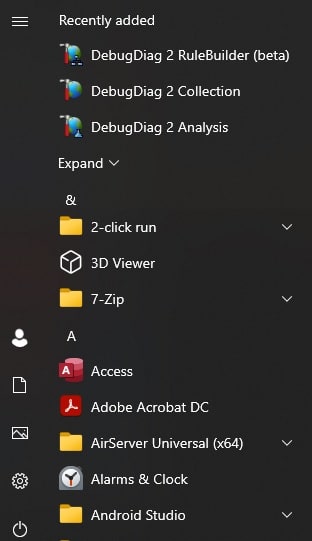
Step 1
Go to start and find and open the newly installed software “DebugDiag 2 Collection“.
Step 2
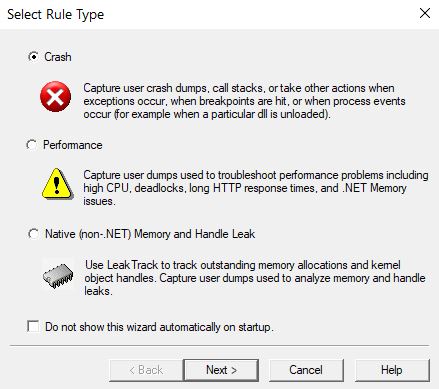
Keep the point on default “Crash” click next.
Step 3
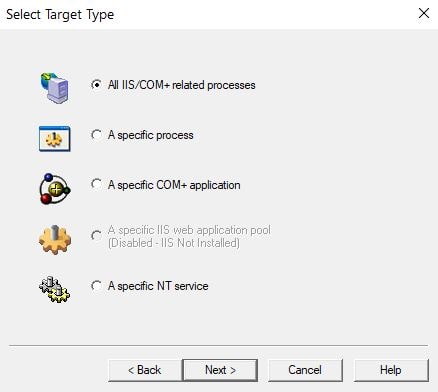
Select very first option if not selected and hit next.
Step 4
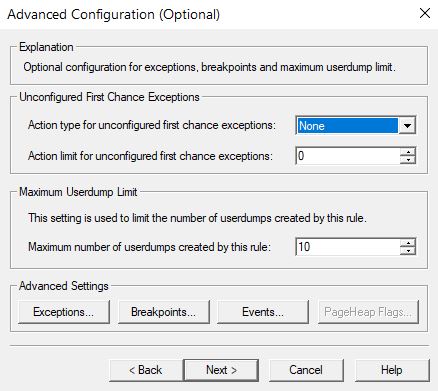
Do not change anything in this step hit next.
Step 5
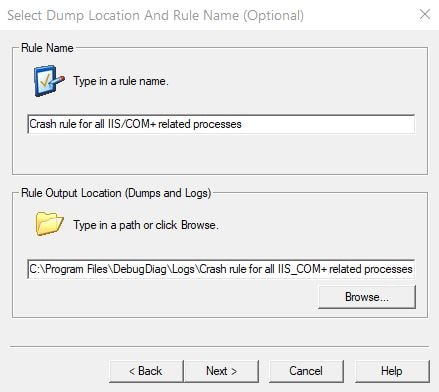
Leave here default path the root directory of the windows.
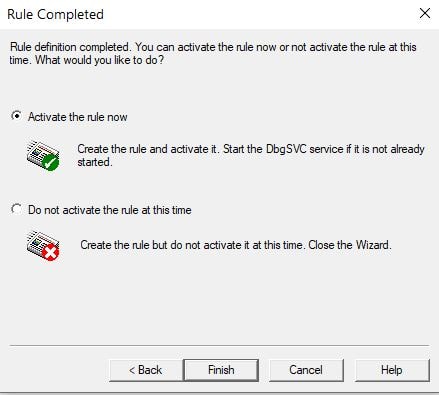
Step 6
Installation is done, click on finish.
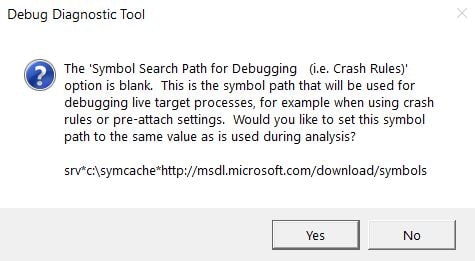
Step 7
You will see the below message once the installation is done, simply click on Yes to open Debug tool.
Steps to save Memory dump with DebugDiag tool
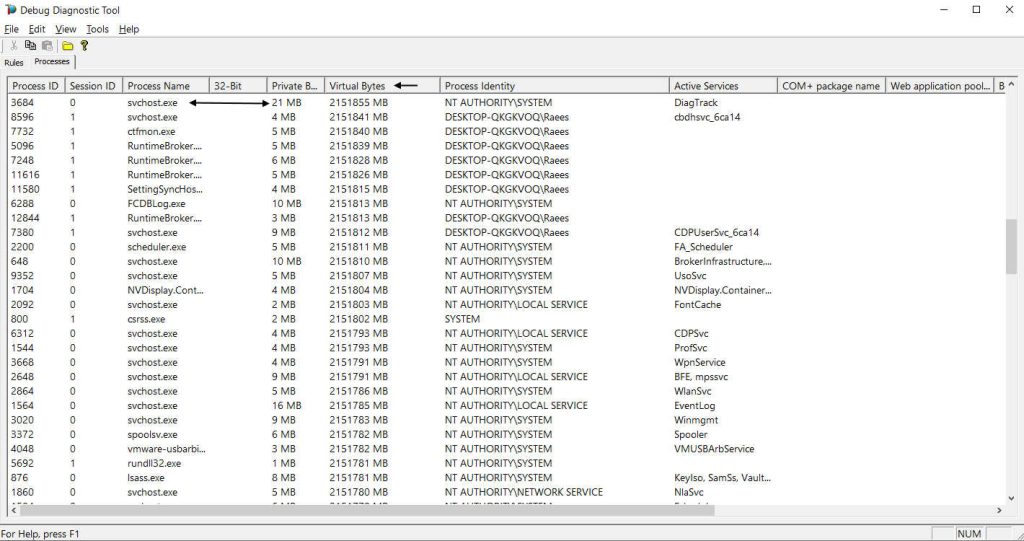
On my local system, I have sorted by Memory and found svchost.exe is taking high memory on the server.
Step 1
Open the DebugDiag tool and click on “Virtual Bytes” which will sort processes on top which are consuming high memory. Here, we can see “svchost.exe” is consuming more memory.
Note : To check only web application consumption, click on “Web application pool“.
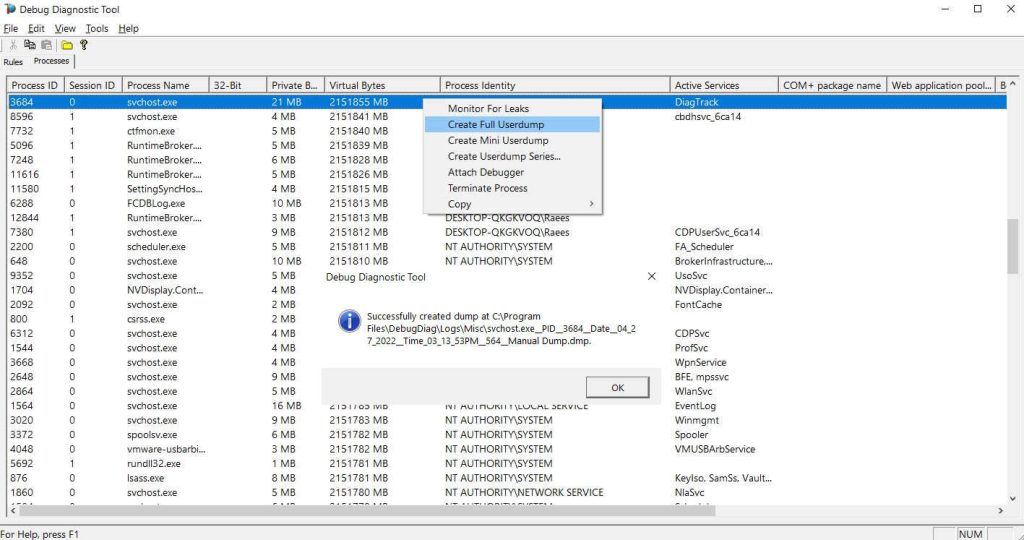
Step 2
Right-click on the process and go for “Create Full Userdump“. You must see the message of dump successfully created.
Step 3
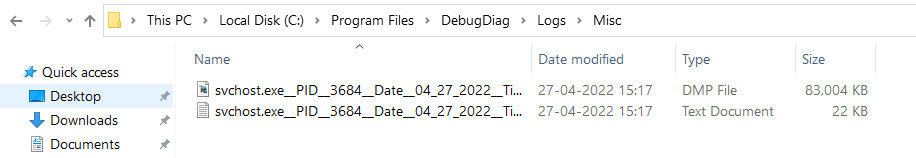
You will find downloaded dumps in the “C:\Program Files\DebugDiag\Logs\Misc” directory.
Video Tutorial
This tool is very useful for IIS web application. We can take a memory dump of web applications that is causing high memory usage in the server. We can take IIS web application dump by sorting web application pool from Debug tool.